Print by Number:: G7 工作重點
兩個重點: 灰色平衡與調子(NPDC)
1. Gray Balance: 動態式灰色平衡
灰色目標值依紙張顏色變動
Wanted a* = a*_paper * (100 – C%) / 100;
Wanted b* = b*_paper * (100 – C%) / 100;
CMY 灰色組成定義
C% M% Y% C% M% Y%
0 0 0
1.96 1.38 1.38 49.8 39.82 39.89
3.92 2.77 2.77 54.9 44.71 44.71
5.88 4.15 4.15 60 49.8 49.8
7.84 5.61 5.61 65.1 54.9 54.9
10.2 7.41 7.41 69.8 60.16 60.16
14.9 11 11 74.9 66.07 66.07
20 14.9 14.9 80 71.77 71.77
25.1 18.8 18.8 85.1 78.06 78.06
30.2 22.91 22.91 89.8 84.61 84.61
34.9 26.78 26.78 94.9 92.2 92.2
40 30.98 30.98 98.04 96.86 96.86
45.1 35.48 35.48 100 100 100
G7 Gray Balance at 300% CMY : a*= 0, b*=0
超過75%原則上a*=0, b*=0
2. NPDC (neutral Print Density Curves): 0%~25%維持不變,25%以後動態式壓縮
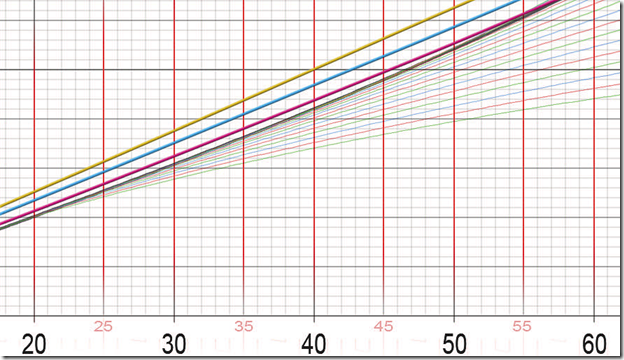
依ISO標準狀態,CMY 濃度值落在1.37(上圖), K 濃度值落在1.69(下圖)。The G7 NPDC Graph for a CMY gray scale. The bold black curve shows the nominal NPDC of ISO-standard commercial printing with a neutral density range of 1.37. Other curves are for higher or lower neutral density ranges.

The G7 NPDC Graph for a black-only gray scale The bold black curve shows the nominal NPDC of ISO-standard commercial printing with a neutral density range of 1.69. Colored curves are for higher or lower neutral density ranges
The G7 NPDC fitting function is designed to compress shadow detail before sacrificing highlight detail in a way that is most acceptable to most observers on most images. The compression effect moves progressively closer to the highlight as density range decreases, so that very dark shadow details are never completely lost.
SiCoTVI Formula
For TV (dot%) = 0.0 – 100.0;
SiCoY (cmy) = 100 – 95.7 * SiCoTV/100;
SiCoY (k) = 100 – 98 * SiCoTV/100;
SiCoTV = TV + SiCoTVI;
SiCoTVI (cmy) = (((1 – 1/10^ SIN(TV/100)) / 0.8559448 – TV/100) * 2.744 – ((0.1- 1/10^ COS(TV/100)) / – 0.1882025 – TV/100) * 0.594) * 25.2
SiCoTVI (k) = (((1 – 1/10^ SIN(TV/100)) / 0.8559448 – TV/100) * 2.2295 – ((0.1- 1/10^ COS(TV/100)) / – 0.1882025 – TV/100) * 1.0395) * 20.1
| TV | NPDC ND | SiCoTVI (cmy) | SiCoY (cmy) | SiCoTV | NPDC ND | SiCoTVI (k) | SiCoY (k) | SiCoTV |
| 0 | 0.00 | 0.00 | 100.00 | 0.00 | 0.00 | 0.00 | 100.00 | 0.00 |
| 5 | 0.05 | 6.05 | 89.43 | 11.05 | 0.04 | 4.46 | 90.73 | 9.46 |
| 10 | 0.10 | 11.08 | 79.83 | 21.08 | 0.09 | 8.23 | 82.13 | 18.23 |
| 15 | 0.15 | 15.18 | 71.11 | 30.18 | 0.13 | 11.36 | 74.16 | 26.36 |
| 20 | 0.20 | 18.45 | 63.21 | 38.45 | 0.18 | 13.91 | 66.76 | 33.91 |
| 25 | 0.25 | 20.95 | 56.03 | 45.95 | 0.22 | 15.93 | 59.89 | 40.93 |
| 30 | 0.31 | 22.76 | 49.51 | 52.76 | 0.27 | 17.47 | 53.48 | 47.47 |
| 35 | 0.36 | 23.95 | 43.58 | 58.95 | 0.32 | 18.55 | 47.52 | 53.55 |
| 40 | 0.42 | 24.57 | 38.20 | 64.57 | 0.38 | 19.22 | 41.97 | 59.22 |
| 45 | 0.48 | 24.68 | 33.31 | 69.68 | 0.43 | 19.50 | 36.79 | 64.50 |
| 50 | 0.54 | 24.32 | 28.88 | 74.32 | 0.50 | 19.42 | 31.97 | 69.42 |
| 55 | 0.60 | 23.52 | 24.85 | 78.52 | 0.56 | 19.00 | 27.48 | 74.00 |
| 60 | 0.67 | 22.33 | 21.21 | 82.33 | 0.63 | 18.24 | 23.32 | 78.24 |
| 65 | 0.75 | 20.75 | 17.94 | 85.75 | 0.71 | 17.16 | 19.48 | 82.16 |
| 70 | 0.82 | 18.82 | 15.00 | 88.82 | 0.80 | 15.76 | 15.96 | 85.76 |
| 75 | 0.91 | 16.54 | 12.40 | 91.54 | 0.89 | 14.03 | 12.75 | 89.03 |
| 80 | 0.99 | 13.92 | 10.12 | 93.92 | 1.01 | 11.96 | 9.87 | 91.96 |
| 85 | 1.09 | 10.96 | 8.16 | 95.96 | 1.13 | 9.55 | 7.34 | 94.55 |
| 90 | 1.18 | 7.66 | 6.54 | 97.66 | 1.29 | 6.77 | 5.16 | 96.77 |
| 95 | 1.28 | 4.02 | 5.24 | 99.02 | 1.47 | 3.60 | 3.37 | 98.60 |
| 100 | 1.37 | 0.00 | 4.30 | 100.00 | 1.70 | 0.00 | 2.00 | 100.0 |
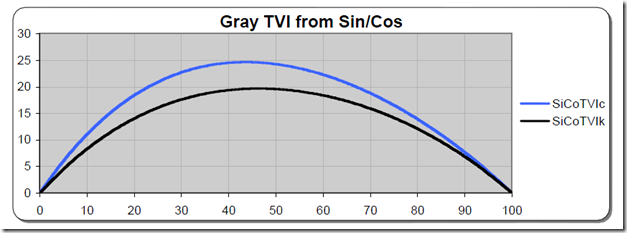
參考點: TVI on 50%: 24.32(CMY),19.42(K)
The ‘Gray TVI’ graphs produced by the Sin/Cos formula, from which the master NPDC curves were
derived
NPDC ND = IF(SiCoY > 0, LOG10(100/SiCoY), 1000)
3. HR, SC and HC (快速檢查點: 亮部區域,暗部反差,亮部反差)
neutral density (ND) = Log10(100/Y); (where Y > 0 < 100);
亮部區域 目標值: 0.54(CMY), 0.50(K) (for 1.3ND or higher)
暗部反差 目標值: 0.90(CMY), 0.90(K) (for commercial printing)
亮部反差 目標值: 0.25(CMY), 0.22(K) (常數狀態)

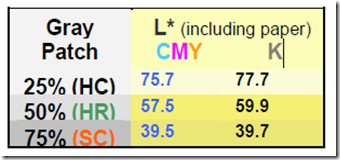
Nominal gray patch ND aim values (minus paper) for normal GRACoL ink densities
HR_cmy = ND(50c,40m,40y) – ND(paper) **0.54 (for 1.3ND or higher)
HR_k = ND(50K) – ND(paper) **0.50 (for 1.3ND or higher)
SC_cmy = ND(75c,66m,66y) – ND(paper) **0.90 (for commercial printing)
SC_k = ND(75k) – ND(pape) **0.90 (for commercial printing)
HC_cmy = ND(25c,19m,19y) – ND(paper)** constant of 0.25 (paper subtracted) for all printing processes.
HC_k = ND(25k) – ND(paper)** constant of 0.22 (paper subtracted) for all printing processes.
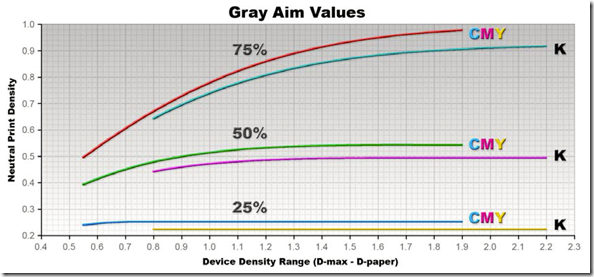
Graph showing HR, SC, and HC aim values for devices with different dynamic ranges
4. G7® Compliance (G7 階段, 維持G7一致性)
4.1 G7 Grayscale (灰色平衡,NPDC)
僅做 灰平衡及NPDC,不做紙張及油墨限定。
4.2 G7 Targeted (ISO 12647-2)
限定紙張及油墨(如 ISO 12647-2),其結果應接近 ISO 12647-2,但因 ink trapping, opacity, ink film variation, screening system 等關係,數據不盡與ISO 12647-2 相符。
4.3 G7 Characterized (SWOP, Gracol 打樣)
經由某種控制方式(如 icc profile)來符合與某印刷規格(如 SWOP, Gracol)的色彩。數位打樣即其應用方式 的 一種。
4.4 G7 Extreme (開放色域空間)
當印刷設備有更大的能力(較寬的色域或較高的濃度範圍如噴墨印表機),一樣可由G7調校方式達成 G7 Extreme 階段,這類設備可經由其他控制方式(如icc profile)達到其他印刷規格如SWOP, Gracol等。
Working procedure 工作步驟
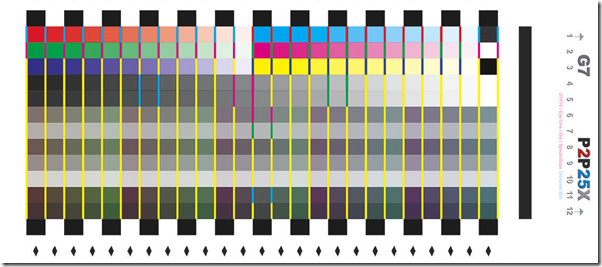
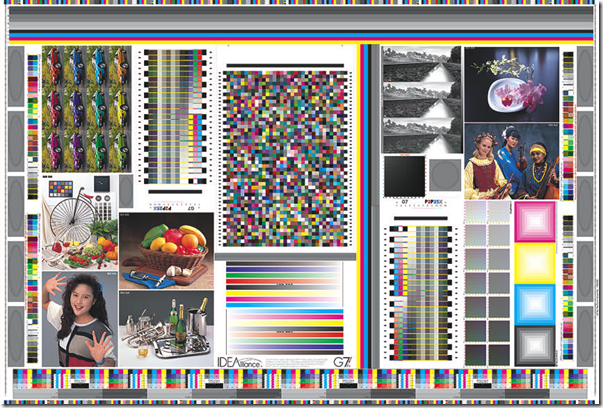
1. 輸出 P2P25X導表及GyayFinder22導表
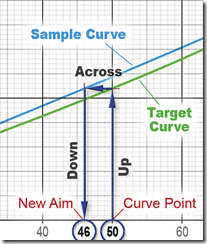
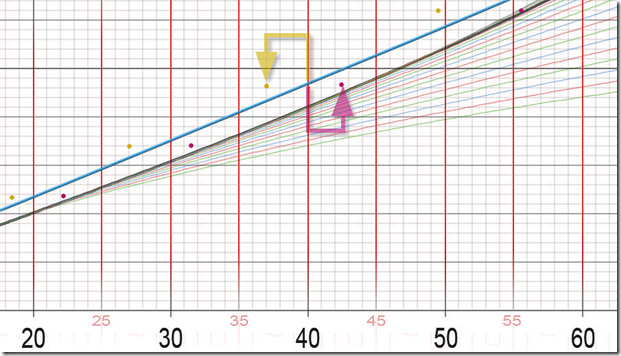
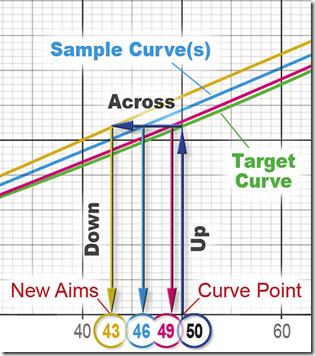
2. Plotting the Common CMY NPDC Curve (依P2P25X量測數據繪出NPDC)
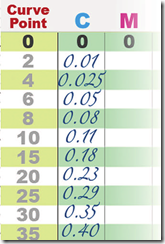
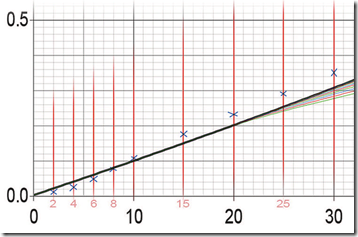
Left: List of CMY ND values. Right: Marking the ND vs. dot % intersections with crosses.
3. Calculating RIP Values Without Gray Balance (如無需做灰色較正,重拉NPDC即可)
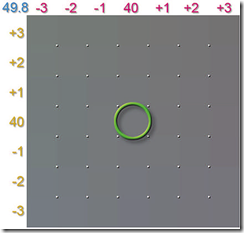
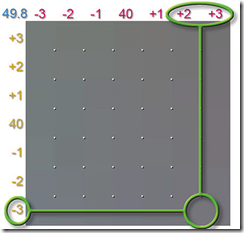
4. Calculating RIP Values With Gray Balance(如需做灰色較正,依Grayfinder22數據,重繪CMY NPDC 曲線)
Gray factor = (100 – C%) / 100;
Wanted a* = a*_paper * Gray factor;
Wanted b* = b*_paper * Gray factor;
4.1 因M對灰色色相有較大影響,CMY數據須相對M值做修正。
Adjusting for NPDC Error Due to Gray Balance
ND_correction = (new_aim_C – new_aim_M) / 2;
corrected aim_C = new aim_C + ND_correction;
corrected aim_M = new aim_M + ND_correction;
corrected aim_Y = new aim_Y + ND_correction;
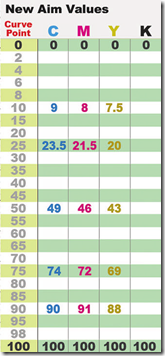
NEW AIMS ND_CORRECTION CORRECTED AIMS
C M Y M 修正 C M Y
8 9 7.5 (8 – 9) / 2 = -0.5 7.5 8.5 7
21.5 23.5 20 (21.5 – 23.5) / 2 = -1 20.5 22.5 19
46 49 43 (46 – 49) / 2 = -1.5 44.5 47.5 41.5
72 74 69 (72 – 74) / 2 = -1 71 73 68
90 91 88 (90 – 91) / 2 = -0.5 89.5 90.5 87.5
5. Calibration Using IDEAlink® Curve (Curve 軟體使用)
Measuring the P2P Target in ColorPort
Loading Measurement File(s) in IDEAlink Curve
Choosing the Optimum Curve Points
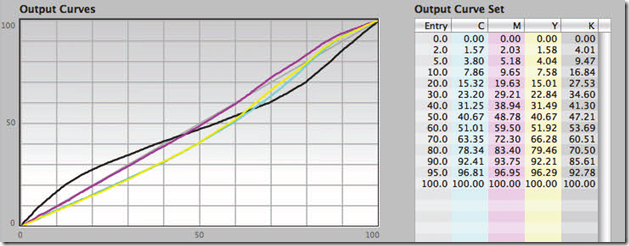
IDEAlink Curve’s Output Curve display under the Create Curves tab (2,5,10 for hight detail)
Determining if Gray Balance Needs Correcting
When the maximum difference between C, M and Y in any Output Curve Set row is equal to or
greater than 1%, and the device consistently prints with the same gray balance error, different C,
M and Y RIP curves are recommended.
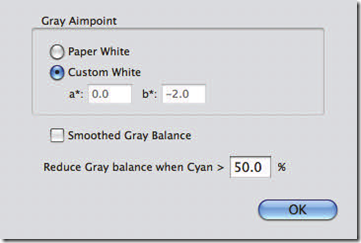
Gray Balance switched ON in the Create Curves tab
Reduce Gray Balance when Cyan > (…)%
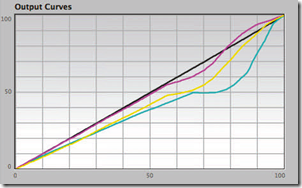
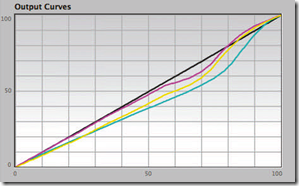
A threshold of 90 (left) showing curve “flats”. 50 (right) is safer.
Applying the Output Curve Set to the RIP
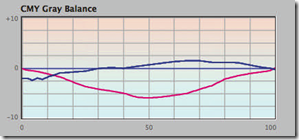
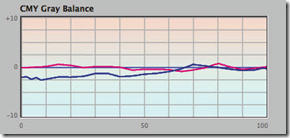
Gray Balance curves before (Left) and after (Right) successful G7 calibration
A good G7 calibration should show no delta values greater than +/-1.0% from substrate to 50%, and none greater than +/- 2% above 50
Printing to Nominal Solid Ink Values
**檢驗規範(G7 Target)
1. Grayscal 要求:
1.1 測量P2P25 第四行(K)及第五行(CMY) 23 steps
1.2 NPDC Average Weighted Delta L* =1.5,Peak Delta L*=3.0
1.3 灰平衡 (CMY only) Average Weighted Delta F*=1.5, Peak Delta F*=3.0
2. CMYK follow ISO, RGB follow ISO。
3. 平均性(uniformity):
3.1 兩個 P2P25間,最大色差<=3個 Delta-E(ab)
3.2 P2P25 與 IT8.7/4 間, 最大色差<=6個 Delta-E(ab)
4. ColorSpace 要求:
4.1 紙張 <= 3 Delta-E
4.2 CMYK <= 5 Delta-E, hue difference<2.5
4.3 RGB < 6 Delta-E
4.4 IT8.7/4 所有色塊 average<4 Delta-E, 95%之色塊 < 6 Delta-E
Tags: 色彩管理, G7, ISO 12647-2, TVI, 印刷
2 Comments
 Comments RSS
 TrackBack Identifier URI
 Leave a comment






最近我也在研究 G7 校正的相關議題,但我遇到很多問題,希望您能夠幫助我
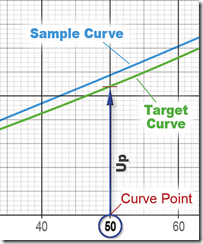
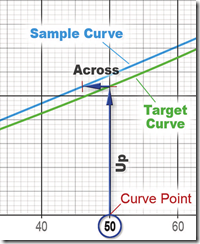
1) FanGraph 中 CMY 或 K ideal 曲線的點如何取得
2) 研讀 G7 How To 有辦法算出 CMYK 應調整多少的值(像是你第5點提到的 Calibration Using IDEAlink® Curve (Curve 軟體使用)
謝謝您
Comment by Wen on 十二月 1, 2015 2:00 下午
你好,
1) FanGraph 中 CMY 或 K ideal 曲線的點如何取?
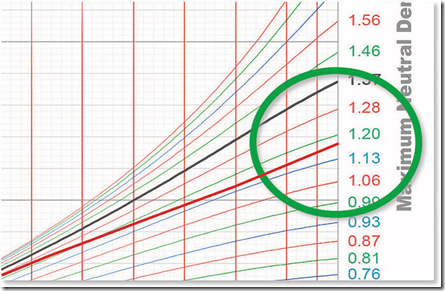
從P2P導表量測,取第4行(K)最下面一格(K100)的濃度值去找到FanGraph右邊最接近的濃度值,對應的curve 即其ideal curve 。
CMY curve 同樣意思,取第5行(CMY)最下面一格(CMY100)的濃度值去對應FanGraph。
2) 研讀 G7 How To 有辦法算出 CMYK 應調整多少的值(像是你第5點提到的 Calibration Using IDEAlink® Curve (Curve 軟體使用)
基本上要做G7還是得透過他門的Curve軟體;我自己經驗,照著 G7 How To 做一趟FanGraph 要4小時,還是得不出好的結果,不過到是可以把觀念搞清楚。
Comment by Administrator on 十二月 1, 2015 11:32 下午