a Practice of WYSIWYG::by Number
WYSIWYG (What You See Is What You Get) is terminology that dated like 15 years ago when DTP just started. nothing new about it, but I haven’t seen anyone demonstrate the terminology in a more explicit way::by Number. So, here we are:
1. what you see on the LCD display (by Number via iOne) :
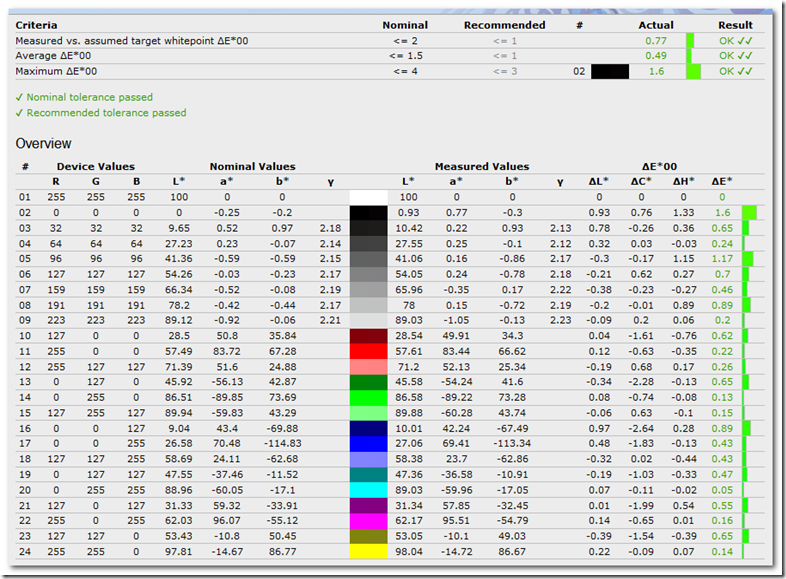
a. LCD (a Samsung F2830) Display calibration quality: 
b. What you see of the Fogra CMYK media wedge V2 after calibration (by number via iOne)
| 55.1 | -37 | -50 | 61.53 | -23.67 | -47.23 | 15.06 | ||
| 66.86 | -24.73 | -37.1 | 66.24 | -25.22 | -39.65 | 2.67 | ||
| 79.72 | -12.53 | -21.75 | 79.31 | -12.89 | -22.63 | 1.04 | ||
| 48 | 74 | -3 | 48.99 | 75.87 | -2.34 | 2.22 | ||
| 60.84 | 50.59 | -6.74 | 60.12 | 52.23 | -6.12 | 1.90 | ||
| 76.42 | 25.78 | -6.91 | 75.99 | 26.46 | -7.5 | 1.00 | ||
| 89 | -5 | 93 | 92.52 | -8.88 | 81.95 | 12.23 | ||
| 90.34 | -4.7 | 62.56 | 90.19 | -5.19 | 63.64 | 1.20 | ||
| 92.19 | -3.47 | 31.15 | 92.61 | -4.01 | 33.3 | 2.26 | ||
| 53.08 | 37.72 | 28.91 | 51.59 | 38.71 | 26.03 | 3.39 | ||
| 41.55 | 22.73 | 16.76 | 39.66 | 22.77 | 14.22 | 3.17 | ||
| 31.92 | 39.95 | 23.98 | 29.36 | 40.68 | 26.04 | 3.37 | ||
| 32.54 | 44.45 | -1.8 | 30.6 | 45.06 | -3.94 | 2.95 | ||
| 51.28 | 1.27 | 44.5 | 49.78 | 1.72 | 46.58 | 2.60 | ||
| 34.56 | -36.44 | 13.86 | 33.58 | -36.73 | 12.11 | 2.03 | ||
| 35.95 | -26.19 | -20.86 | 35.95 | -23.43 | -20.53 | 2.78 | ||
| 20.92 | 9.58 | -23.65 | 20 | 5.81 | -24.42 | 3.96 | ||
| 88.97 | 0 | -1.85 | 89.24 | -0.02 | -1.88 | 0.27 | ||
| 82.79 | 0 | -1.69 | 82.49 | -0.23 | -1.96 | 0.46 | ||
| 69.28 | 0 | -1.35 | 68.89 | -0.24 | -1.32 | 0.46 | ||
| 54.4 | 0 | -0.97 | 53.62 | -0.44 | -0.78 | 0.92 | ||
| 36.62 | 0 | -0.52 | 35.54 | 0.6 | -0.74 | 1.25 | ||
| 16 | 0 | 0 | 15.56 | -1.4 | 0.02 | 1.47 | ||
| 24 | 22 | -46 | 22.07 | 19 | -46.59 | 3.62 | ||
| 40.88 | 17.88 | -36.58 | 39.69 | 17.43 | -35.8 | 1.49 | ||
| 63.69 | 10.33 | -23.76 | 62.96 | 11.11 | -25.86 | 2.36 | ||
| 47 | 68 | 48 | 47.21 | 70.31 | 50.41 | 3.34 | ||
| 58.5 | 47.1 | 37.88 | 57.69 | 49.04 | 37.51 | 2.13 | ||
| 74.18 | 22.92 | 21.37 | 73.6 | 23.73 | 21.72 | 1.06 | ||
| 50 | -65 | 27 | 52.63 | -55.61 | 27.92 | 9.79 | ||
| 62.13 | -39.82 | 21.01 | 61.37 | -41.65 | 21.51 | 2.04 | ||
| 76.97 | -19.06 | 11.03 | 76.5 | -20.29 | 11.79 | 1.52 | ||
| 71.22 | 18.85 | 17.25 | 70.79 | 19.28 | 17.67 | 0.74 | ||
| 71.24 | 22.15 | 73.08 | 72.67 | 23 | 67.51 | 5.81 | ||
| 47.74 | 71.2 | 16.24 | 48.56 | 73.61 | 16.17 | 2.55 | ||
| 38.01 | 55.38 | -20.94 | 35.54 | 56.98 | -21.89 | 3.09 | ||
| 73.66 | -22.81 | 67.57 | 74.46 | -23.42 | 65 | 2.76 | ||
| 52.33 | -52.31 | -20.15 | 57.37 | -39.06 | -17.78 | 14.37 | ||
| 43.34 | -17.03 | -48.62 | 45.85 | -11.4 | -47.6 | 6.25 | ||
| 95 | 0 | -2 | 95.08 | -0.02 | -1.75 | 0.26 | ||
| 88.54 | -0.38 | -3.13 | 88.62 | -0.64 | -3.52 | 0.48 | ||
| 81.95 | -0.89 | -4.1 | 81.74 | -1.33 | -4.45 | 0.60 | ||
| 67.67 | -1.96 | -4.37 | 67.04 | -1.54 | -5.03 | 1.00 | ||
| 52.22 | -2.48 | -3.53 | 51.09 | -1.64 | -4.51 | 1.72 | ||
| 37.47 | -3.86 | -3.15 | 36.2 | -3.78 | -3.64 | 1.36 | ||
| 26.29 | -6.81 | -3.41 | 25.51 | -10.24 | -3.93 | 3.56 | ||
| Max | 15.06 | Average | 3.06 | |||||
| 90% percentile | 6.03 | 1.93 |
I got maximum delta-E of 15.06 and Average delta-E of 3.06, If I exclude out the most saturate patches (90% percentile), I got maximum delta-E of 6.03 and Average delta-E of 1.93.
2. What you get from a Epson 9890 print out (by Number via iOne).
| 55.1 | -37 | -50 | 54.25 | -37.9 | -49.68 | 1.28 | ||
| 66.86 | -24.73 | -37.1 | 65.37 | -25.53 | -36.45 | 1.81 | ||
| 79.72 | -12.53 | -21.75 | 77.48 | -14.29 | -21.43 | 2.87 | ||
| 48 | 74 | -3 | 47.89 | 73.76 | -2.52 | 0.55 | ||
| 60.84 | 50.59 | -6.74 | 60.46 | 49.74 | -7.14 | 1.01 | ||
| 76.42 | 25.78 | -6.91 | 75.88 | 26.8 | -7.46 | 1.28 | ||
| 89 | -5 | 93 | 87.94 | -5.88 | 91.97 | 1.72 | ||
| 90.34 | -4.7 | 62.56 | 88.94 | -5.88 | 62.13 | 1.88 | ||
| 92.19 | -3.47 | 31.15 | 92.03 | -5.28 | 30.1 | 2.10 | ||
| 53.08 | 37.72 | 28.91 | 52.6 | 36.5 | 26.48 | 2.76 | ||
| 41.55 | 22.73 | 16.76 | 40.54 | 18.07 | 13.17 | 5.97 | ||
| 31.92 | 39.95 | 23.98 | 31.85 | 39.51 | 23.73 | 0.51 | ||
| 32.54 | 44.45 | -1.8 | 32.38 | 43.1 | -4.46 | 2.99 | ||
| 51.28 | 1.27 | 44.5 | 49.46 | -3.63 | 40.45 | 6.61 | ||
| 34.56 | -36.44 | 13.86 | 33.66 | -38.27 | 12.87 | 2.27 | ||
| 35.95 | -26.19 | -20.86 | 35.79 | -26.74 | -21.73 | 1.04 | ||
| 20.92 | 9.58 | -23.65 | 21.54 | 7.83 | -24.51 | 2.05 | ||
| 88.97 | 0 | -1.85 | 89.15 | -0.2 | -2.69 | 0.88 | ||
| 82.79 | 0 | -1.69 | 83.31 | 0.85 | -2.95 | 1.61 | ||
| 69.28 | 0 | -1.35 | 68.26 | -1.95 | -4.77 | 4.07 | ||
| 54.4 | 0 | -0.97 | 52.93 | -1.89 | -3.62 | 3.57 | ||
| 36.62 | 0 | -0.52 | 36.51 | -1.25 | -2.84 | 2.64 | ||
| 16 | 0 | 0 | 15.68 | -0.82 | -0.12 | 0.89 | ||
| 24 | 22 | -46 | 22.59 | 21.31 | -47.68 | 2.30 | ||
| 40.88 | 17.88 | -36.58 | 39.7 | 16.03 | -37.96 | 2.59 | ||
| 63.69 | 10.33 | -23.76 | 62.7 | 9.57 | -24.51 | 1.46 | ||
| 47 | 68 | 48 | 46.85 | 67.85 | 48.11 | 0.24 | ||
| 58.5 | 47.1 | 37.88 | 58.89 | 48.03 | 37.69 | 1.03 | ||
| 74.18 | 22.92 | 21.37 | 73.83 | 23.98 | 21.13 | 1.14 | ||
| 50 | -65 | 27 | 49.95 | -65.96 | 26.42 | 1.12 | ||
| 62.13 | -39.82 | 21.01 | 61.29 | -41.39 | 19.67 | 2.23 | ||
| 76.97 | -19.06 | 11.03 | 75.96 | -19.8 | 8.83 | 2.53 | ||
| 71.22 | 18.85 | 17.25 | 70.75 | 18.95 | 15.77 | 1.56 | ||
| 71.24 | 22.15 | 73.08 | 71.53 | 24.21 | 72.77 | 2.10 | ||
| 47.74 | 71.2 | 16.24 | 47.8 | 71.55 | 16.76 | 0.63 | ||
| 38.01 | 55.38 | -20.94 | 38.05 | 54.24 | -21.74 | 1.39 | ||
| 73.66 | -22.81 | 67.57 | 72.84 | -24.75 | 65.25 | 3.13 | ||
| 52.33 | -52.31 | -20.15 | 52.04 | -53.1 | -22.28 | 2.29 | ||
| 43.34 | -17.03 | -48.62 | 43.01 | -16.97 | -49.45 | 0.90 | ||
| 95 | 0 | -2 | 94.04 | 0.14 | -0.26 | 1.99 | ||
| 88.54 | -0.38 | -3.13 | 88.27 | -0.83 | -4.26 | 1.25 | ||
| 81.95 | -0.89 | -4.1 | 82.12 | -0.42 | -4.83 | 0.88 | ||
| 67.67 | -1.96 | -4.37 | 66.88 | -2.56 | -6.54 | 2.39 | ||
| 52.22 | -2.48 | -3.53 | 51.27 | -3.62 | -5.77 | 2.69 | ||
| 37.47 | -3.86 | -3.15 | 36.05 | -4.37 | -5.28 | 2.61 | ||
| 26.29 | -6.81 | -3.41 | 24.11 | -7.38 | -4.46 | 2.49 | ||
| Max | 6.61 | Average | 2.03 | |||||
| 90% percentile | 3.06 | 2.10 |
I got maximum delta-E of 6.61 and Average delta-E of 2.03, If I exclude out the most saturate patches (90% percentile), I got maximum delta-E of 3.06 and Average delta-E of 2.10.
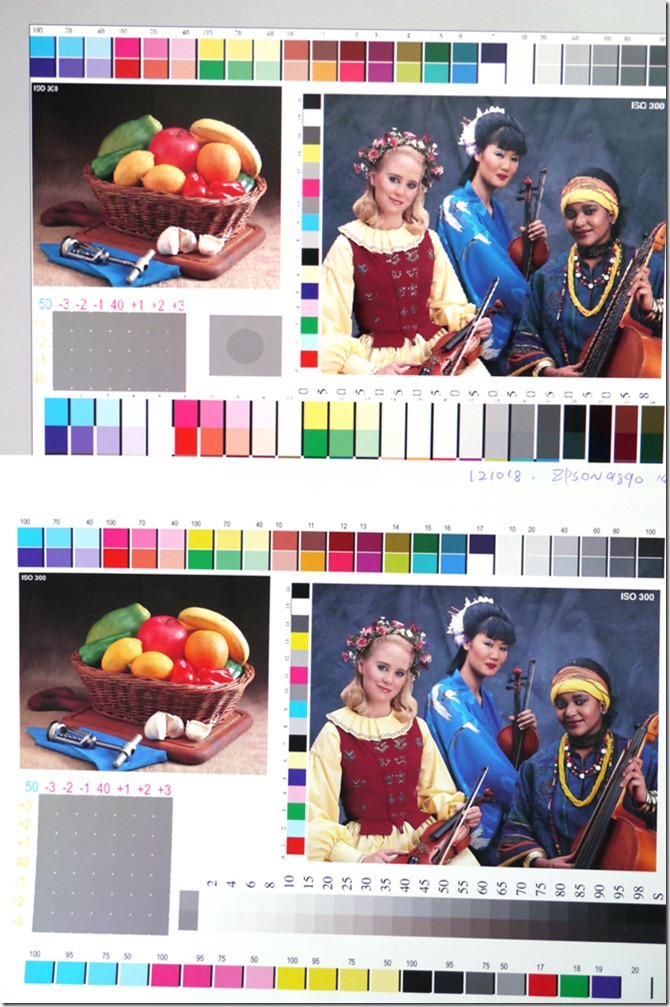
How it looks from the camera (through a Panasonic GX1, White point set at 5000K), light source as here.
LCD on the top and printout at the bottom.
Comment:
The system works, I could keep the Samsung in an accurate position for the 90% percentile (of average 1.93), the most saturate part is just out of its capability.
As for WYSIWYG from LCD to printout, acceptable, there is always leeway to fine tune.
n
Tags: ArgyllCMS, Color management system, dispcalgui, Fogra, Media wedge, soft proof
2 Comments
 Comments RSS
 TrackBack Identifier URI
 Leave a comment

[…] to a Samsung F2380 here:http://www.fredkuo.idv.tw/wordpress/?p=1523 Like […]
自動引用通知 by Fred Kuo :: Blog » Archive » Display to the Number::Fogra 39 Softproof capability on 3 7 月, 2013 11:50 上午
[…] related post: http://www.fredkuo.idv.tw/wordpress/?p=1555 http://www.fredkuo.idv.tw/wordpress/?p=1523 http://www.fredkuo.idv.tw/wordpress/?p=889 Like […]
自動引用通知 by Fred Kuo :: Blog » Archive » Display to the Number::Fogra 39 Softproof capability on iPad on 15 7 月, 2013 10:34 下午